What is SNAP?
Abstract
Both research and industry are facing the issue of analyzing vast amounts data. Much of that data is highly interrelated and provides challenges for sense making. Graph visualization has the potential of aiding the sense making process. However, graph visualization and exploration are hard problems as well. This project attempts to develop a graph-visualization framework (SNAP) that allows for the creation of highly customized visualizations.
Problem Statement
Graph visualization continues to be a challenging field within the visualization domain and its importance is increasing due to the prevalence of graph-based problems in e-Design. The challenges of graph visualization stem from the nature of graphs and the amounts of data to be represented. Thus, while a graph with 50 nodes and 70 edges may be easy to visualize, this does not hold for graphs orders of magnitude larger. Furthermore, oftentimes it is not even the case that the structural data is the point of main interest, but rather the attributes or metadata associated with the graph, the nodes, or the edges. We focus on the visualization of ontologies. Ontologies (semantic networks) can be represented using mixed pseudo graphs (i.e., graphs that can contain loops, multiple edges between nodes, and both directed and undirected edges). As such, ontology visualization faces the same problems as graph visualization, most notably the so-called “Hairball Effect” (see Figure 1).
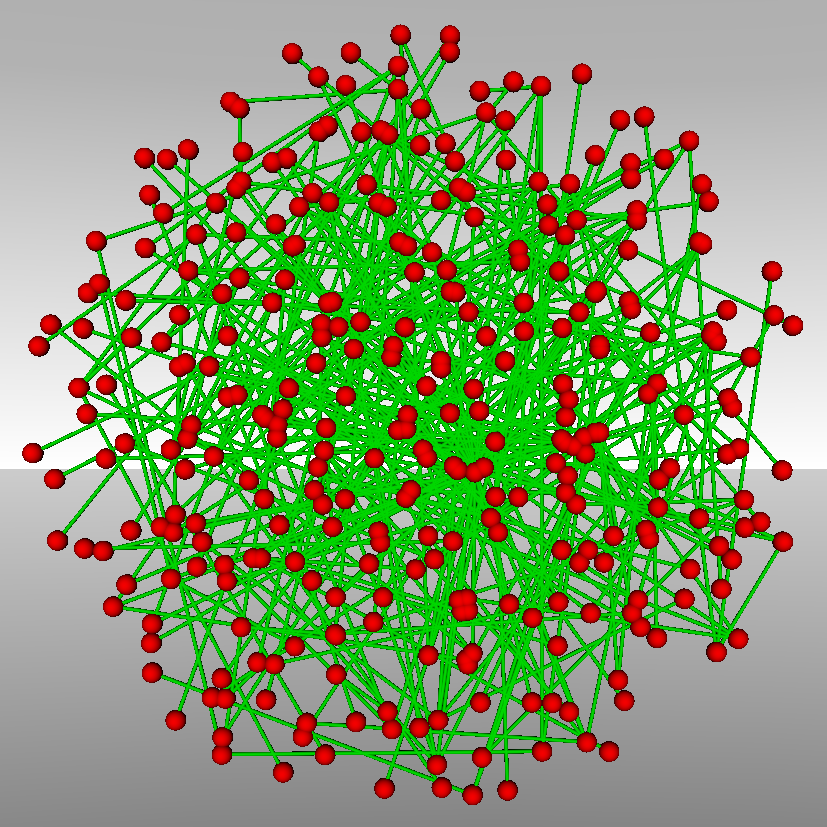
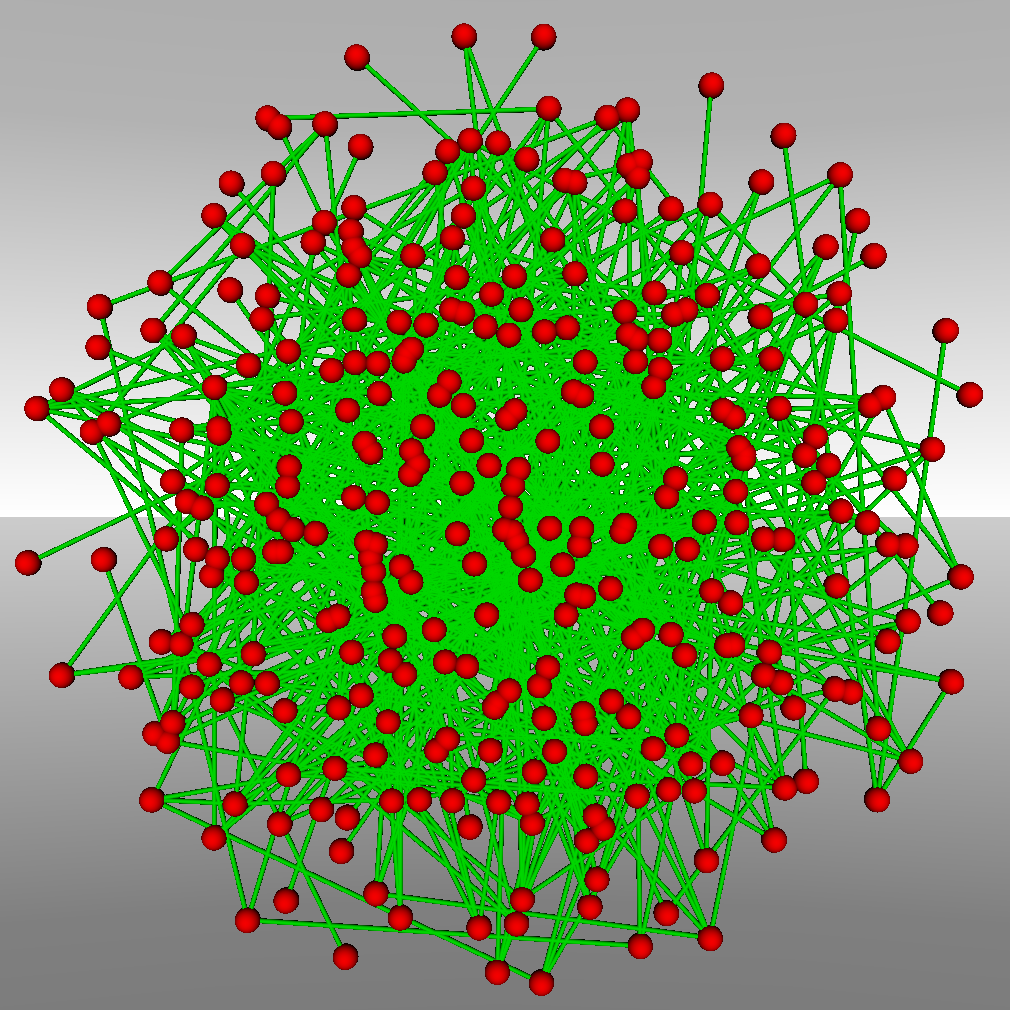
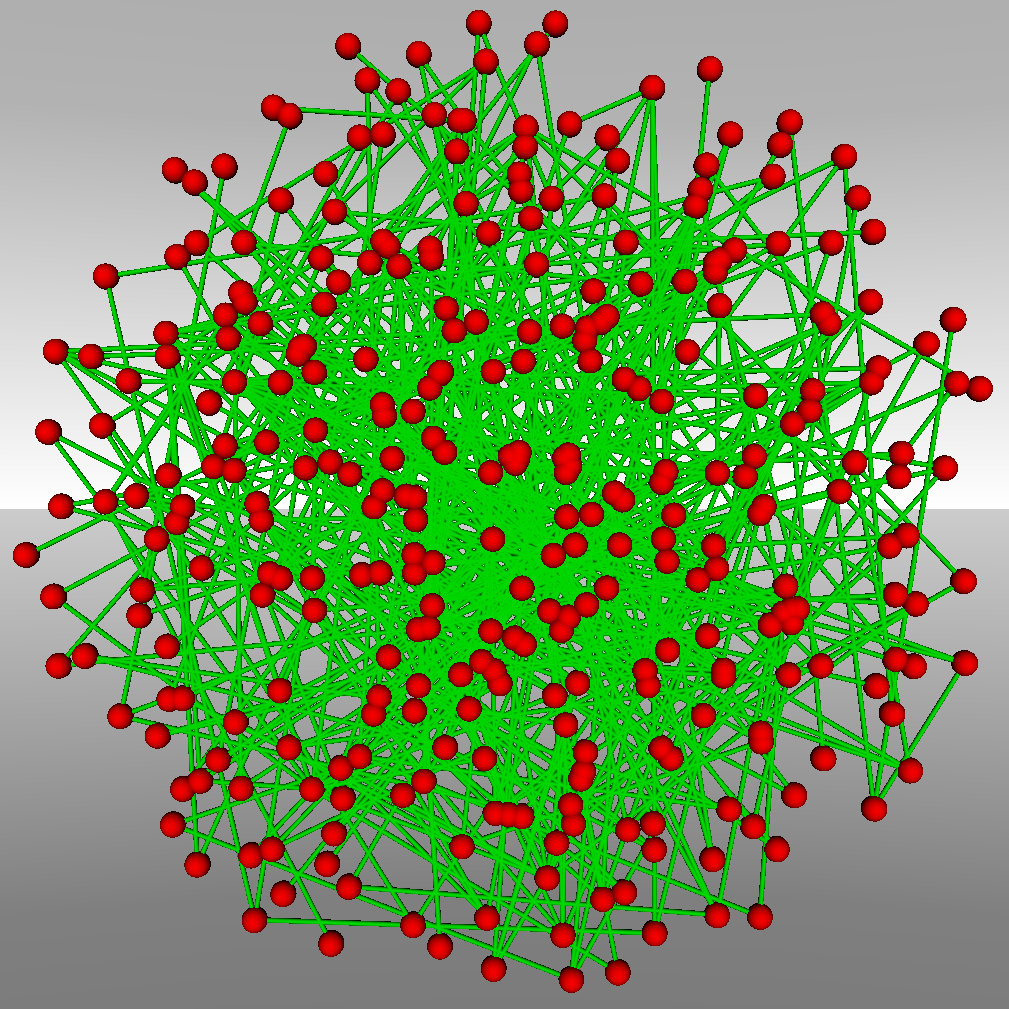
Figure 1: Ontology visualization using a 2D force-directed layout with one (left), two (center), or three (right) relationships.
Algorithms and toolkits for graph visualization have the disadvantage that they are not specifically targeted at ontologies. Yet ontologies have an inherent structure that can be leveraged in layout algorithms: they contain hierarchical relationships (e.g., the subclass relationship) and data type properties, which represent paths of length one. This structure disappears in general graph layouts. Furthermore, the metadata contained in ontologies can be used to enhance its visual representation. However, support for custom mappings from the metadata contained in ontologies to different visual properties (such as color, shape, size, etc.) is not widely supported in graph visualization toolkits today. Moreover, current graph visualization toolkits only provide support for a limited number of input and output formats without the possibility for easy extension. This limits the usefulness of these toolkits due to the huge variety of data formats prevalent in both research and industry.
Approach and Method
As for the language SNAP is built on, Java was chosen. To address the issues described in the previous section, we decided to provide our own representations of a graph as opposed to using an existing one in order to avoid tight coupling with external libraries. Furthermore, creating our own representation allowed us to achieve a clear distinction between structural components of a graph (i.e., nodes, edges, hyper-edges, graphs, graph universes, etc.) on the one hand and their metadata on the other hand. This allows us to represent arbitrary graphs, including ontologies, without having to rely on work-arounds. However, at the same time, this requires the translation of existing formats (e.g., GraphML, OWL) into the internal representation. SNAP is built using a layered architecture (Error: Reference source not found). This allows it to avoid tight coupling on both the input and output side. Currently, only graphs in GraphML format are fully supported. However, such an internal data structure based on first-principles, provides the flexible and expressive creation of mappings for visualization.
Framework Architecture
When it comes to visually representing graphs there is only a finite number of visual properties that can be varied. It is important not only to show connectivity but also parts of the metadata in order to be able to navigate within or reason about the graph. To that end, additional properties have to be chosen. Realistically, these properties include a subset of node-shape, node-size, edge-size, color (of both edges and nodes), and node position (in x, y, and z directions). Additionally, one might provide information about nodes or edges in labels attached to the object in question. In order to maintain the user's ability to reason about the graph using the aforementioned visual properties, the mapping between metadata and structural properties to visual properties have to be consistent across the entire graph (or collection of graphs). Furthermore, the mappings should be able to reflect the type of metadata or structural property as well as the type of the visual property. Multiple mappings can then be applied to build a 3D layout that defines the visual representation of the graph.
Deliverables and Benefits
The main deliverable of this research is an Open Source Java graph-visualization toolkit with modular architecture (SNAP framework). Our SNAP framework provides flexible, ‘pluggable’ mappings for visually representing the properties of ontologies (or any other graphs). Key features of the framework are
- Internal data structure that can represent arbitrary graphs
- Layered architecture: separable importers, graph representation & visualization, and exporters
- Flexibility to define mappings of node and edge metadata to visual properties
- Flexibility to define mappings of structural properties of a graph to visual properties
- Formal transformations on data types (interval-to-interval, one-to-one, many-to-one)
- Solar system layout provider
Industrial Relevance
Both industry and research are trying are facing the problem of analyzing increasingly large amounts of inter-related data. Unfortunately, current visualization toolkits do not cater to the multitude of available formats this data is stored in and toolkits do not provide extensive capabilities for the customization of the visualizations they produce. The SNAP framework addresses these issues by enabling the creation of highly customized visualizations based on mappings as well as pre-defined layouts.